Vehicle crime in Rugby: the streets to know about
Police recorded 106 vehicle crimes within a mile of Rugby town centre in the last 12 months — theft of vehicles, theft from vehicles and vehicle interference.
The short answer
Rugby ranks #93 of 111 UK town centres we track for vehicle crime, with 106 offences in 12 months — though falling. Parking here isn’t reckless, but it rewards care: most offences cluster on a handful of streets (named below), and most are opportunist — visible deterrents end them.
106
Vehicle crimes, September 2025 – August 2026
-45%
Last 3 months vs the same 3 months a year earlier
9
Average per month
Rate per 1,000 residents · year ending June 2026
Vehicle crime across the Warwickshire force area
4.96
per 1,000 people, Warwickshire
5.04
England and Wales
3,196
offences recorded, 12 months
Vehicle crime in the Warwickshire force area runs at close to the national rate. Rugby is one of the local authority areas inside it.
This is a different measure from the count above. The 106 figure counts crimes within a mile of Rugby town centre, from police street-level records. The rate here covers the whole Warwickshire force area, from police recorded crime as published by ONS. Different geography and a different collection basis, so the two totals are not comparable with each other.
Source: Office for National Statistics, Crime in England and Wales: Police Force Area data tables, year ending June 2026. Police recorded crime collected by the Home Office. How we use it. Published under the Open Government Licence v3.0.
The last 12 months
Where it clusters in Rugby
| # | Street (on or near) | Vehicle crimes (15 months) |
|---|---|---|
| 1 | Oswald Way | 6 |
| 2 | King Edward Road | 4 |
| 3 | South Street | 3 |
| 4 | Argyle Street | 3 |
| 5 | Lawford Road | 3 |
| 6 | Gardeners End | 3 |
| 7 | Kingsway | 3 |
| 8 | Woodside Park | 2 |
| 9 | Brookside Close | 2 |
| 10 | Schoolfield Grove | 2 |
What to do with this: if you regularly park on or near the streets above, that’s where the defences below earn their keep — most of these offences are opportunist, and the easiest car on the street is the one taken. Check your insurance excess too: it’s often more than the cost of every deterrent combined.
Figures are street-level police records within one mile of Rugby town centre — police anonymise locations to the nearest mapped street point, so counts are indicative of the immediate area rather than exact addresses. Compare Rugby with other towns on the UK vehicle crime league table, or check the roads themselves on the Rugby accident hotspot map.
Rugby's roads are Warwickshire's responsibility
Collisions above are counted for Rugby. The body that maintains those roads, sets the speed limits and decides which junctions get fixed is Warwickshire — so that is the level at which the record can be compared with anywhere else in Britain.
Per mile driven
150 of 192
Per resident
52 of 188
Risk band
Below average
Five-year trend
up 26.4%
Those two numbers disagree, and that is the story. Warwickshire sits 52 of 188 measured per resident but 150 of 192 measured per mile actually driven — a gap of 98 places. Measured against the traffic the network actually carries rather than the number of people living beside it, the record is better than the headline per-head figure implies.
The full record for Warwickshire — severity-adjusted casualties, the breakdown of who is being hurt, the darkness and ice profile, and a comparison against its ONS statistical neighbours rather than the national average — is on its own page.
Warwickshire’s full road risk record →What actually changes the odds in Rugby
Data is only useful if it changes what you do. These three are picked from Rugby’s own figures above, each with the number that prompted it. Every guide explains how the thing works before it suggests buying anything, and most cost less than a third of a typical insurance excess.
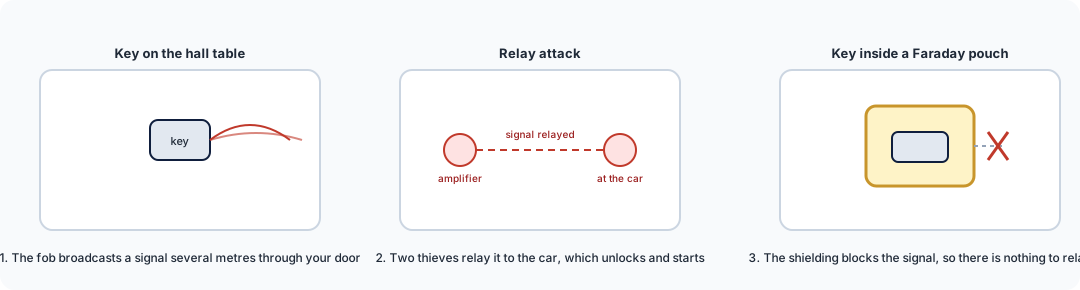
Faraday key pouch / box
£9–£25
Even at Rugby's 136 vehicle crimes per 100,000 residents, relay theft is the method that needs no tools and leaves no damage. The pouch is the cheapest thing that stops it.
How it works →
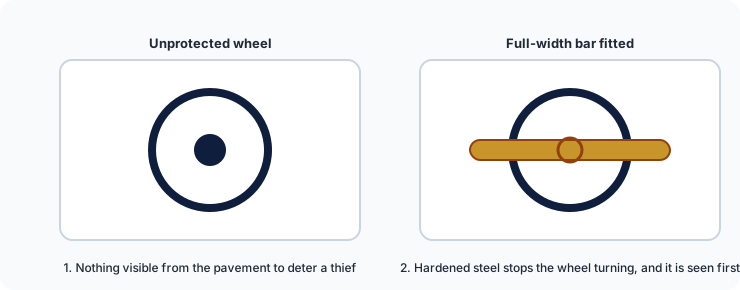
Steering wheel lock
£40–£70
Vehicle theft is target selection: thieves work a street and take the easiest car. A visible attack-rated bar moves your car down that list before anyone touches it.
How it works →
We are a data business, not a retailer: these link to our guides, which link on to retailers. Some of those links earn us a small commission at no cost to you, and we hold no stock and take no payment for placement. All security guides.
Need this data for your own work?
Site and junction reports from £95, next working day. Free for community groups, campaigners and journalists.