Accident hotspots in Birkenhead: where crashes cluster
Police recorded 700 road collisions in Birkenhead in 2025. We mapped every one to find the junctions and roads where they concentrate.
68
Road Risk Score
Birkenhead ranks 16 of 125 towns we score — band D, above average
197.7 people killed or seriously injured per 100,000 residents, 119.3 vehicle crimes per 100,000, 63.6% of collisions involving someone outside a car, and a five-year trend of -4.5%. How the score works.
Vulnerable road users in Birkenhead (2025)
232 of Birkenhead's 700 collisions (33%) involved pedestrians; 140 of Birkenhead's 700 collisions (20%) involved cyclists; 73 of Birkenhead's 700 collisions (10%) involved motorcyclists. Together those collisions left 139 people killed or seriously injured.
| Road user | Collisions | Share of all collisions | Killed or seriously injured | Serious-outcome rate |
|---|---|---|---|---|
| Pedestrians | 232 | 33% | 67 | 29% |
| Cyclists | 140 | 20% | 44 | 31% |
| Motorcyclists | 73 | 10% | 28 | 38% |
105 of Birkenhead’s collisions in 2025 involved a child casualty.
Birkenhead’s busiest collision clusters (2025)
Each circle is a ~100m cluster of police-reported collisions. Larger circles = more collisions; red = at least one death. Click a circle for details.
The short answer
Birkenhead recorded 700 police-reported collisions in 2025 — rising (+3.2% on 2024), or about 796 per 100,000 residents. Its most stubborn risk is Breck Road, Anfield, a hotspot in 5 of the last 5 years.
700
Collisions in Birkenhead (2025)
961
People injured or killed
+3.2%
Change vs 2024
~676
Modelled collisions in 2026 on current trend
Birkenhead’s junctions that stay dangerous
These locations recorded multiple collisions in at least four of the last five years (2021–2025) — a persistent pattern, not a one-off bad year.
Breck Road, Anfield
A580
14 collisions across 5 hotspot years · 16 casualties · 5 serious or fatal
Fleet Street, Vauxhall
B5339
13 collisions across 5 hotspot years · 14 casualties · 2 serious or fatal
Fordham Street, Kirkdale
A59
12 collisions across 5 hotspot years · 15 casualties · 3 serious or fatal
Birkenhead’s worst accident spots
| # | Location | Road | Collisions | Casualties | Serious | Fatal |
|---|---|---|---|---|---|---|
| 1 | Ranelagh Street, Vauxhall | A5038 | 6 | 6 | 1 | 0 |
| 2 | Upper Duke Street, Toxteth | A5039 | 4 | 4 | 0 | 0 |
| 3 | Liscard Village, Liscard | B5143 | 4 | 4 | 2 | 0 |
| 4 | Back Bridport Street, Vauxhall | A5047 | 4 | 4 | 1 | 0 |
| 5 | Islington Square, Everton | Local road | 4 | 5 | 0 | 1 |
What to do with this: if your regular routes cross the junctions above, they deserve extra care at peak times — these aren’t random locations, they’re where collisions repeat. For context, Birkenhead’s rate of 796 per 100,000 residents compares with an average of 220 across the 125 areas we track. A junction with a documented five-year history is also the strongest evidence a campaign can put in front of a councillor.
Vulnerable road users in Birkenhead in 2025: 232 collisions involved a pedestrian, 140 a cyclist and 73 a motorcyclist — overall, 795.5 collisions per 100,000 residents.
Area definition: figures cover 6km radius of the town centre. Per-100k rates use the mid-2023 ONS population estimate for the named town or district; where the area is radius-defined, treat the rate as indicative.
These figures come from the Department for Transport’s STATS19 dataset — every collision reported to the police in 2025 — clustered to roughly 100 metres and labelled via OpenStreetMap. Only police-reported incidents are included, so minor damage-only bumps are undercounted. See the full UK hotspots analysis for the national picture and methodology.
Need this cut a different way? A junction’s full history, cyclist or pedestrian casualties on their own, or a before-and-after on a scheme: we produce those, free for community groups, campaigners and journalists.
Birkenhead over 5 years
Collisions per year in Birkenhead
2025: 700 (up 3.2% on the year before) · peak 811 in 2022 · -4.5% across the period
Axis clipped to the data range to show year-on-year movement.
2022 was Birkenhead’s worst year of the period with 811 collisions, against 678 in 2024. Of 2025’s 961 casualties, 174 were killed or seriously injured (6 deaths, 168 serious).
Build the Birkenhead story from this page
Every line below is computed from the official DfT STATS19 dataset and updates when new data is released — copy, check, publish. Free to use with a link to this page as the source.
- “Police recorded 700 road collisions in Birkenhead in 2025, injuring or killing 961 people (DfT STATS19).
- “2022 was Birkenhead's worst year of the last 5 (811 collisions, against 678 in 2024).
- “Birkenhead's collision rate is 796 per 100,000 residents, against an average of 220 across the 125 areas we track.
- “232 collisions involved pedestrians, 140 collisions involved cyclists, 73 collisions involved motorcyclists — with 139 of those people killed or seriously injured.
- “105 collisions in Birkenhead involved a child casualty in 2025.
Attribution: “Analysis by Swift Assist (swiftassistuk.co.uk) of DfT STATS19 data” with a link to this page. Methodology: how we process the data.
Birkenhead's roads are Wirral's responsibility
Collisions above are counted for Birkenhead. The body that maintains those roads, sets the speed limits and decides which junctions get fixed is Wirral — so that is the level at which the record can be compared with anywhere else in Britain.
Per mile driven
75 of 192
Per resident
164 of 188
Risk band
Above average
Five-year trend
down 17.3%
Those two numbers disagree, and that is the story. Wirral sits 164 of 188 measured per resident but 75 of 192 measured per mile actually driven — a gap of 89 places. Almost every published comparison quietly uses the per-head measure, which flatters places that carry a lot of through-traffic. On the measure that accounts for how much driving actually happens here, the record is worse than the usual figure suggests.
The full record for Wirral — severity-adjusted casualties, the breakdown of who is being hurt, the darkness and ice profile, and a comparison against its ONS statistical neighbours rather than the national average — is on its own page.
Wirral’s full road risk record →What actually changes the odds in Birkenhead
Data is only useful if it changes what you do. These three are picked from Birkenhead’s own figures above, each with the number that prompted it. Every guide explains how the thing works before it suggests buying anything, and most cost less than a third of a typical insurance excess.
Helmet camera
£50–£200
20% of collisions in Birkenhead involve someone on a bike. In a disputed pull-out, footage from the rider's viewpoint is what settles liability.
How it works →
Alarmed disc lock
£20–£50
Motorcyclists are in 10% of Birkenhead's collisions, and bikes are also lifted rather than ridden away. An alarmed disc lock covers the theft half for about £30.
How it works →
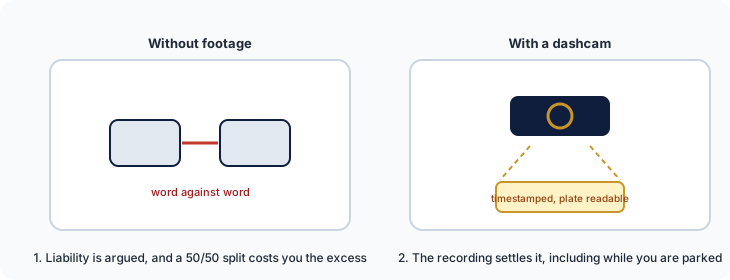
Dashcam (parking mode)
£50–£150
33% of collisions here involve a pedestrian, and those are the cases most often argued over. Footage removes the argument.
How it works →
We are a data business, not a retailer: these link to our guides, which link on to retailers. Some of those links earn us a small commission at no cost to you, and we hold no stock and take no payment for placement. All security guides.
Related on Swift Assist
UK accident hotspots (national)
Britain's 20 worst collision clusters, mapped from official data.
Read more →Cyclist collision map (national)
Where cyclists are hurt across Britain, from the same records.
Read more →Free data for campaigners
Junction histories, corridor studies and custom cuts, free for community groups.
Read more →Need this data for your own work?
Site and junction reports from £95, next working day. Free for community groups, campaigners and journalists.