Road risk in Inverclyde
The official road casualty record for Inverclyde, from DfT STATS19.
Police recorded 39 injury collisions in Inverclyde in 2025, hurting 51 people, of whom 17 were killed or seriously injured.
Not ranked. Inverclyde is held out of our national tablebecause it recorded 17 killed or seriously injured, below the 20 needed for the derived percentages to mean anything. Every figure here is the real recorded number. At this size the derived percentages describe chance more than they describe the place, so there is no rank attached to them. How the floors work.
- Collisions
- 39 in 2025
- People hurt
- 51 casualties
- Killed or seriously injured
- 17
- Killed
- 1
- KSI per billion vehicle miles
- 71.4 (median 80.5)
- KSI, three-year average
- 21.3 a year
- Severity-adjusted KSI, 2025
- 18 (recorded: 17)
- Severity-adjusted KSI, three-year average
- 23.3 a year (recorded: 21.3)
- KSI per 100,000 residents
- 21.6
- Population
- 78,550
Compiled by Stephen Hall, Data lead, Swift Assist. Source: DfT STATS19 and DfT road traffic estimates (2025), OGL v3. Updated 2026-10-08.
Five years of collisions in Inverclyde
Across 2021–2025, recorded collisions were up 11.4%, with 2024 the worst year of the period at 48 collisions.
Collisions per year in Inverclyde
2025: 39 (down 18.7% on the year before) · peak 48 in 2024 · +11.4% across the period
Axis clipped to the data range to show year-on-year movement.
Pedestrians, cyclists and riders in Inverclyde
These are the road users with the least protection when something goes wrong, and they carry a disproportionate share of the serious injuries. Across 39 collisions in Inverclyde, the three groups appear 23 times between them — an involvement rate of 59%.
| Road user | Collisions | Share of all collisions |
|---|---|---|
| Pedestrians | 16 | 41.0% |
| Cyclists | 2 | 5.1% |
| Motorcyclists | 5 | 12.8% |
A single collision can involve more than one of these groups and is then counted in each row, so the rows do not add up to a share of the total.
When collisions happen in Inverclyde
DfT records the light level and road surface at every collision, but publishes neither below national level. These are Inverclyde’s own shares over 120 collisions, with the national figure beside each one for comparison.
| Share of collisions | Inverclyde | National | How it reads |
|---|---|---|---|
| In darknessAny collision where the officer recorded darkness, lit or unlit. | 30% | 28.7% | close to the national figure |
| In darkness, no street lightingThe rural lighting picture rather than the urban speeding one. | 5% | 6.3% | below the national figure |
| On a wet road surfaceWet, damp or standing water at the scene. | 35.8% | 24.5% | well above the national figure |
| On snow or iceRare everywhere, and concentrated in a handful of authorities. | 3.3% | 1.4% | more than double the national figure |
The winter effect. Collisions in Inverclyde run 11.1% higher from November to January than from May to July — against 4.5% lower nationally. That is 30 collisions against 27.
What this does not tell you
- A share is not a rate. A high darkness share means darkness accounts for more of Inverclyde’s collisions — not that its roads are more dangerous overall. Read it alongside the casualties-per-mile-driven figure above.
- Condition is recorded, not tested. The officer records the surface and light level at the scene. It is an observation, not a measurement, and it is not a finding that the condition caused the collision.
- Exposure is not controlled for. Fewer people travel at 3am than at 3pm, so a collision in darkness is drawn from a smaller pool of journeys. Without hourly traffic counts, these shares describe when collisions happen rather than how risky an hour is.
Every authority compared on the same measures: winter road risk across Britain.
Road risk in Inverclyde, answered
How dangerous are the roads in Inverclyde?
In the latest official DfT figures, 39 road collisions in Inverclyde injured or killed 51 people, 17 of them killed or seriously injured. Inverclyde is not ranked in our national table because it recorded 17 killed or seriously injured, below the 20 needed for the derived percentages to mean anything.
Are road casualties in Inverclyde rising or falling?
Across 2021–2025, recorded collisions in Inverclyde were up 11.4%, with 2024 the worst year of the period at 48 collisions. Year-to-year movement in a single authority is noisy, so the five-year direction carries more than any single year's change.
Who is being hurt on Inverclyde's roads?
In Inverclyde there were 16 collisions involving pedestrians, 2 involving cyclists and 5 involving motorcyclists, out of 39 in total. Added together that is an involvement rate of 59%, though a collision involving two of those groups is counted in both figures, so it is a comparable index rather than a clean share.
Who is responsible for road safety in Inverclyde?
Inverclyde is a scottish council, and is the highway authority for its own roads. That means it sets local speed limits, designs junctions and crossings, and decides safety scheme spending. Motorways and most trunk roads are managed separately by National Highways in England, Transport Scotland, or the Welsh Government, so the worst road in an area is often not the council's to change. Enforcement sits with the local police force.
Where does this data come from?
DfT STATS19, the record police complete at the scene of every injury collision, published annually under the Open Government Licence, combined with DfT's own road traffic estimates for the mileage denominator. Collision, casualty and KSI counts on this page are for 2025; only the trend compares 2021–2025. STATS19 counts collisions police attended and recorded, so collisions never reported do not appear, and under-reporting is known to be worst for cyclists and for slight injuries.
What actually changes the odds in Inverclyde
Data is only useful if it changes what you do. These three are picked from Inverclyde’s own figures above, each with the number that prompted it. Every guide explains how the thing works before it suggests buying anything, and most cost less than a third of a typical insurance excess.
Alarmed disc lock
£20–£50
Motorcyclists are in 13% of Inverclyde's collisions, and bikes are also lifted rather than ridden away. An alarmed disc lock covers the theft half for about £30.
How it works →
Dashcam (parking mode)
£50–£150
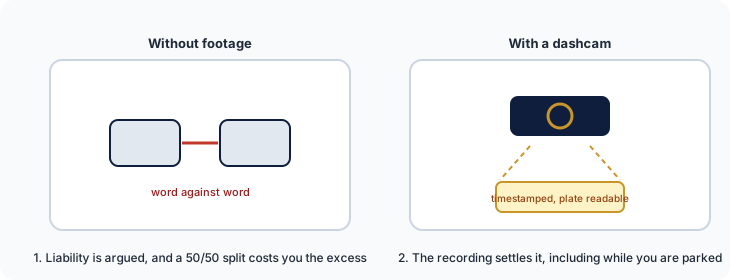
Collisions in Inverclyde are up 11% across the period. A dashcam with parking mode is the cheapest way to keep a disputed claim from becoming a 50/50 split.
How it works →
We are a data business, not a retailer: these link to our guides, which link on to retailers. Some of those links earn us a small commission at no cost to you, and we hold no stock and take no payment for placement. All security guides.
More on Inverclyde and UK road risk
All 192 British authorities ranked
The full sortable league table, with the method behind it.
Read more →Blackspots that were never fixed
Sites with injury collisions in every one of the last five years.
Read more →UK road risk: the national picture
What the official record says about Britain's roads overall.
Read more →Need this cut differently?
Custom analysis by ward, corridor or junction. Free for campaigns and press.
Read more →Free API
Pull these figures programmatically, with provenance on every endpoint.
Read more →